

Code, build and repeat
Stock market returns of more than 20% are common around the world this year. In the US, the S&P 500 remains on track to make it a third consecutive year of returns above 20%, with potentially more than $10trn added to its market capitalisation. That’s a lot of new wealth, on paper. There is a lot of new investment taking place because of the artificial intelligence (AI) boom as well. In addition, lower interest rates complete the triple drivers of US growth. It’s not balanced but it’s not slowing down either.
- Key macro themes – The AI boom becomes ever more dominant
- Key market themes – US corporate earnings growth is very strong
Refined drivers
A few weeks ago I wrote about three key drivers of US economic growth – the wealth effect, favourable credit conditions, and a generally supportive fiscal policy stance. I would nuance that a little now. The AI boom deserves to stand alone - this is a huge driver of the wealth effect, while the balance of economic policy is supportive. The latter reflects supportive monetary and fiscal policy, against what I would term as “America First” policies that reflect the polemic of the current Administration. This week the AI acceleration, supportive monetary policy and the wealth effect were all in focus.
Boom time
The message from US technology companies that reported third quarter (Q3) earnings this week is that the AI investment spurt shows no signs of weakening. More than one of the hyperscalers suggested that capex spending would rise further to ensure capacity kept pace with the increased demand for AI products. There were some signs that investors were a little spooked by the realisation that more and more money will be spent in the quarters ahead, even though earnings, overall, came in above expectations. The big question remains will future profits justify the huge amounts being spent today? The differences in share price reactions to earnings announcements highlighted how investor sentiment is very tuned to the balance between the need to invest and the realisation of future earnings.
Invest to disrupt
The capital spending numbers are huge. The eight biggest stocks in the S&P 500 are spending amounts equivalent to almost 10% of the total private fixed investment spending recorded in the national accounts data. I’m not strictly comparing like with like here, but nearly one in 10 investment dollars is being spent by the big technology companies (some of which will be outside the US of course). Meta reported $18bn on capex in Q3; Microsoft more than $19bn; and Google’s parent Alphabet almost $24bn. It’s hard not to underestimate the impact this spending is having through supply chains and on the broader economy. The message was clear though; the capex is necessary to raise capacity to meet demand for AI through existing and new products. Spending on data centres, computing hardware, energy sources and so on is a huge positive for overall economic growth. The euphoria was intensified when Bloomberg reported that OpenAI was planning an initial public offering with a target valuation of $1trn. Some way to go to catch Nvidia ($5trn) but not bad for a start-up!
Cash burn and borrowing
These companies have a lot of cash to spend. According to Bloomberg, the combined cash and cash equivalent reserves of the top eight companies was around $500bn at the end of Q3. When you are generating the kind of revenues that these guys do it’s no surprise that cash piles build up. They generally don’t have that much debt either compared to total assets and revenues. But that may be starting to change. Meta announced on Thursday that it was borrowing $30bn in the US corporate bond market across six different maturity tranches. The AI arms race is meaning more capex, which needs funding. The book for the bond issue was, apparently, more than $125bn. Bond investors are keen to benefit, in the form of coupon payments, from the anticipated revenues that will accrue based on all that capex taking place. Here’s a thought – is the 5.75% coupon, 2065 maturity a better bet now than Meta stock which pays a 0.3% dividend yield (which has grown at 38%)?
Getting richer
Even though there was a mixed share price reaction to some of the technology company announcements, October has been another good month for the index, which is on track for a 2% total return. In four out of the last five years, November has delivered more than 5% total returns. The market capitalisation of the top 10 stocks in the index has risen by more than $5trn in 2025. That is great for US savings in retirement schemes and brokerage accounts. But of course, the gains are not evenly spread, and Americans are not obviously gung-ho. The Conference Board research organisation reported that its consumer confidence measure fell slightly in October, with the expectations index at 71.5 compared to 91.9 a year ago. For those earning over $125,000 per year though, the confidence index moved decisively higher in October while it fell for those households with incomes below $50,000.
Pause on rates and yields?
On the policy side, the Federal Reserve (Fed) met market expectations and cut rates by 25 basis points (bp) to a range of 3.75% - 4.0%, the lowest level for the Fed Funds Rate in three years. The Fed is operating without sight of official data, leading to increased uncertainty over forthcoming policy steps. There were two dissents at the vote: one to keep rates unchanged and one to cut by 50bp. Fed Chair Jerome Powell himself said that a December cut (which was priced in by markets) was not a foregone conclusion. As a result, bond prices have moved a little lower this week with the 10-year Treasury yield backing up to 4.1%. While the default market expectation has been that of a terminal rate of 3%, to be reached in late 2026, uncertainty about the path of policy rates should mean a higher term premium in the yield curve.
The AI story could also provide upside risks to bond yields. In the long run there could be some disinflationary impact from AI, given its potential to improve competitiveness and disrupt labour markets. But if AI investment is demanding more capital and creating increased demand along the supply chain, there could be an opposite effect. Bonds have had a good run since May; some stabilisation might be necessary now given the lack of data anchors for macro-trading and given Powell’s comments regarding the December rate decision.
Scary monster (and super freaks)
Halloween is here. If you want to get spooked, contemplate the chart below. I was inspired seeing a version of this on LinkedIn this week. It plots the US Conference Board’s Index of Leading Economic Indicators against periods of recession and the Dow Jones Industrial Average. The leading indicators index has been published since 1959 and its components include the Treasury yield curve slope, data on manufacturing new orders, jobless claims and credit growth. AI may be changing the rules, but one interpretation of this chart suggests we are in for a recession and a stock market correction. To paraphrase the witches’ chant from Shakespeare’s Macbeth – “double, double toil and trouble. Artificial intelligence and a stock market bubble”.
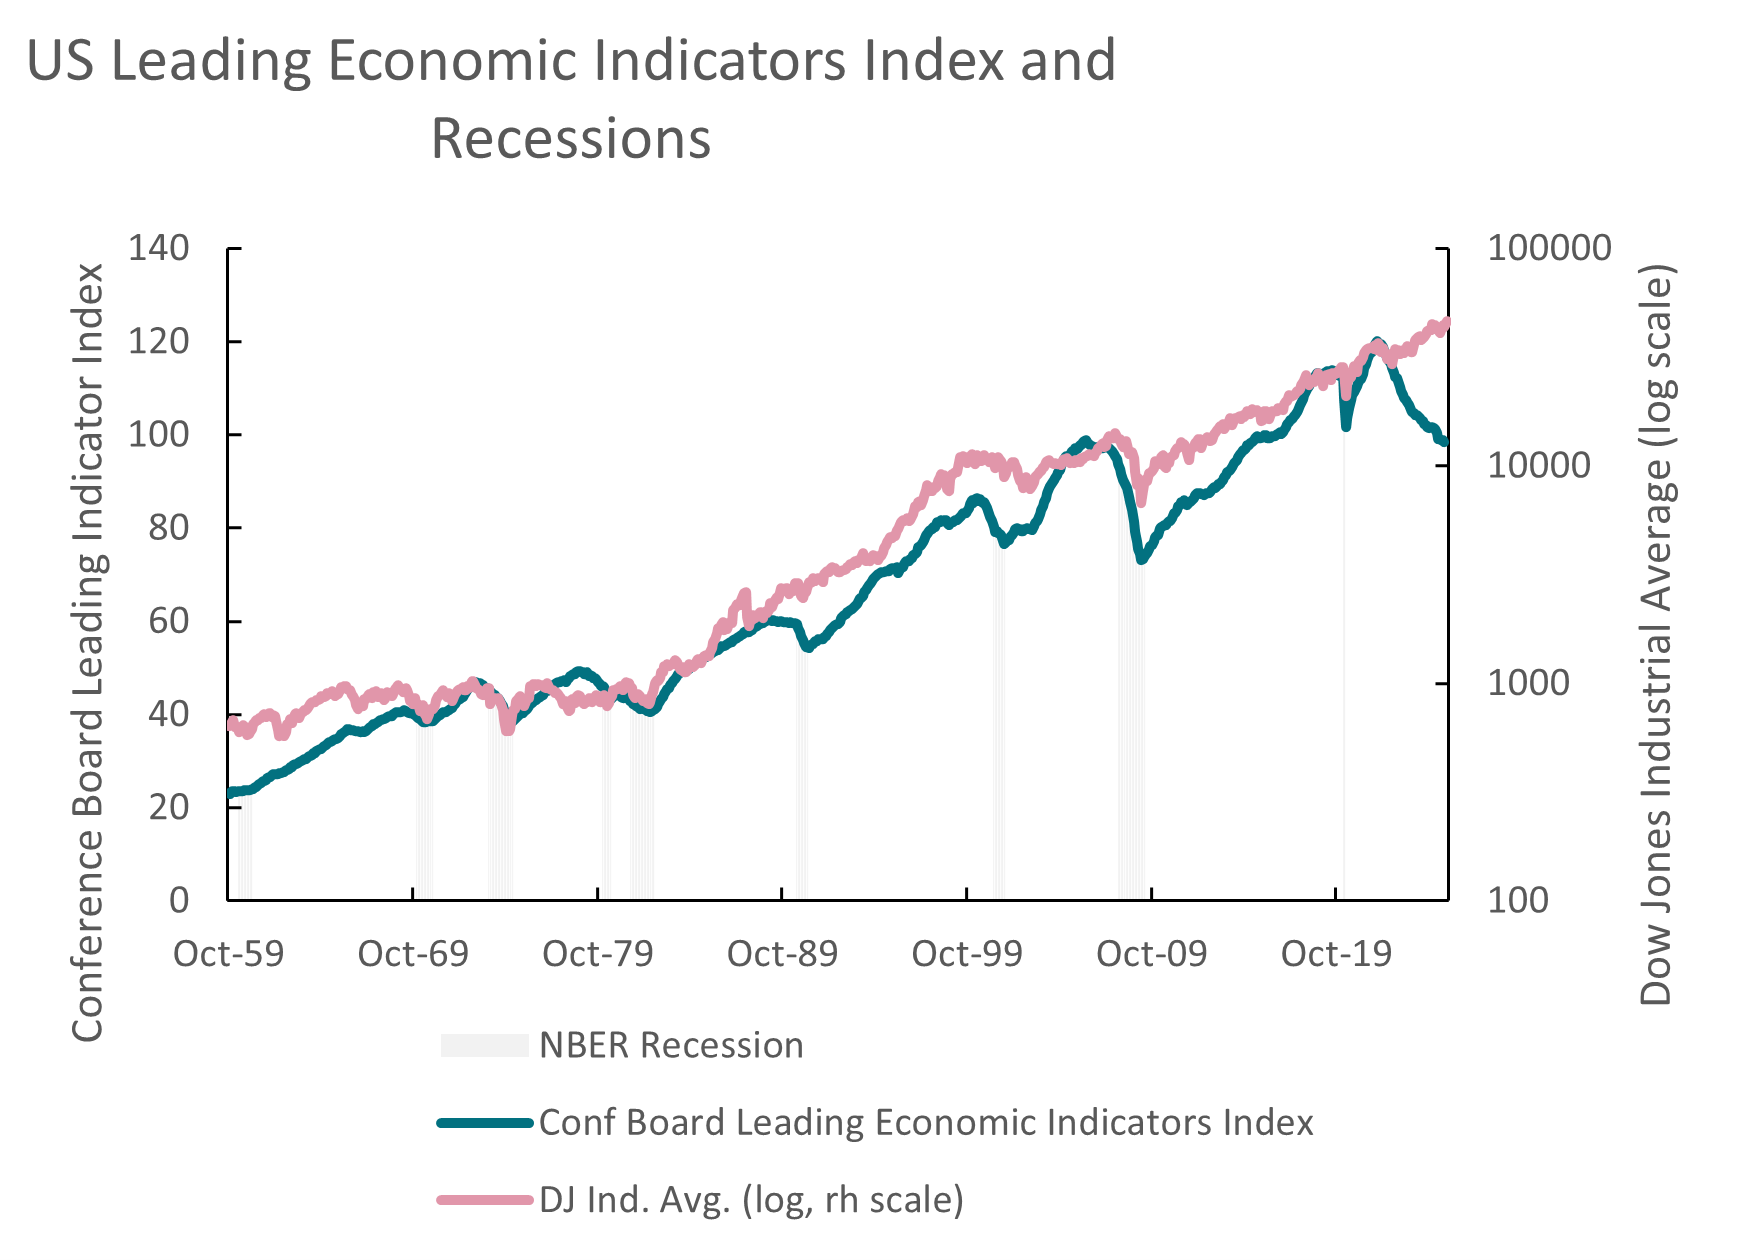
Source: Refinitiv Datastream – 30 October, 2025
Back
I wouldn’t just return to commenting on football just because Manchester United have won three games in a row and Liverpool has lost six out of seven games, would I? At any rate, I feel a whole lot better about my team than I have for some time. Nothing can be taken for granted in football, but at least a chance of finishing in a Champions League qualifying position this year looks more realistic. The team is getting a bit of swagger back and with a new goalkeeper and more dynamic front players, it is looking good. As for my other team, Sheffield Wednesday, the story could not be more different. The club went into administration on 24 October and is now looking for new ownership. Now, where has all the money been made in the world this year? Anyone in Silicon Valley fancy a second (soon to be third) tier English “soccer” team?
Performance data/data sources: LSEG Workspace DataStream, ICE Data Services, Bloomberg, AXA IM, as of 30 October 2025, unless otherwise stated). Past performance should not be seen as a guide to future returns.


Disclaimer
La información aquí contenida está dirigida exclusivamente a inversores/clientes profesionales, tal como se establece en las definiciones de los artículos 194 y 196 de la Ley 6/2023, de 17 de marzo, de los Mercados de Valores y de los Servicios de Inversión.
Este documento tiene fines informativos y su contenido no constituye asesoramiento financiero sobre instrumentos financieros de conformidad con la MiFID (Directiva 2014/65/UE), recomendación, oferta o solicitud para comprar o vender instrumentos financieros o participación en estrategias comerciales por AXA Investment Managers Paris, S.A. o sus filiales.
Las opiniones, estimaciones y previsiones aquí incluidas son el resultado de análisis subjetivos y pueden ser modificados sin previo aviso. No hay garantía de que los pronósticos se materialicen.
La información sobre terceros se proporciona únicamente con fines informativos. Los datos, análisis, previsiones y demás información contenida en este documento se proporcionan sobre la base de la información que conocemos en el momento de su elaboración. Aunque se han tomado todas las precauciones posibles, no se ofrece ninguna garantía (ni AXA Investment Managers Paris, S.A. asume ninguna responsabilidad) en cuanto a la precisión, la fiabilidad presente y futura o la integridad de la información contenida en este documento. La decisión de confiar en la información presentada aquí queda a discreción del destinatario. Antes de invertir, es una buena práctica ponerse en contacto con su asesor de confianza para identificar las soluciones más adecuadas a sus necesidades de inversión. La inversión en cualquier fondo gestionado o distribuido por AXA Investment Managers Paris, S.A. o sus empresas filiales se acepta únicamente si proviene de inversores que cumplan con los requisitos de conformidad con el folleto y documentación legal relacionada.
Usted asume el riesgo de la utilización de la información incluida en este documento. La información incluida en este documento se pone a disposición exclusiva del destinatario para su uso interno, quedando terminantemente prohibida cualquier distribución o reproducción, parcial o completa por cualquier medio de este material sin el consentimiento previo por escrito de AXA Investment Managers Paris, S.A.
Queda prohibida cualquier reproducción, total o parcial, de la información contenida en este documento.
Por AXA Investment Managers Paris, S.A., sociedad de derecho francés con domicilio social en Tour Majunga, 6 place de la Pyramide, 92800 Puteaux, inscrita en el Registro Mercantil de Nanterre con el número 393 051 826. En otras jurisdicciones, el documento es publicado por sociedades filiales y/o sucursales de AXA Investment Managers Paris, S.A. en sus respectivos países.
Este documento ha sido distribuido por AXA Investment Managers Paris, S.A., Sucursal en España, inscrita en el registro de sucursales de sociedades gestoras del EEE de la CNMV con el número 38 y con domicilio en Paseo de la Castellana 93, Planta 6 - 28046 Madrid (Madrid).
© AXA Investment Managers Paris, S.A. 2025. Todos los derechos reservados.
AXA IM y BNP Paribas AM están fusionándose y reorganizando progresivamente nuestras entidades legales para crear una estructura unificada.
AXA Investment Managers se unió al Grupo BNP Paribas en julio de 2025. Tras la fusión de AXA Investment Managers Paris con BNP PARIBAS ASSET MANAGEMENT Europe y sus respectivas sociedades holding el 31 de diciembre de 2025, la nueva compañía ahora opera bajo la marca BNP PARIBAS ASSET MANAGEMENT Europe.